

Hello, is anyone there? It’s economic data telling you that the stock market may be poised to fall more than 20% and no one seems to be listening.
While major indices have seen modest gains so far in 2023, albeit with some wild swings, we’re becoming increasingly confident that the US stock market is set up for sizable losses. Why? It’s in the data.
Treasuries, Taxes and Debt Ceilings
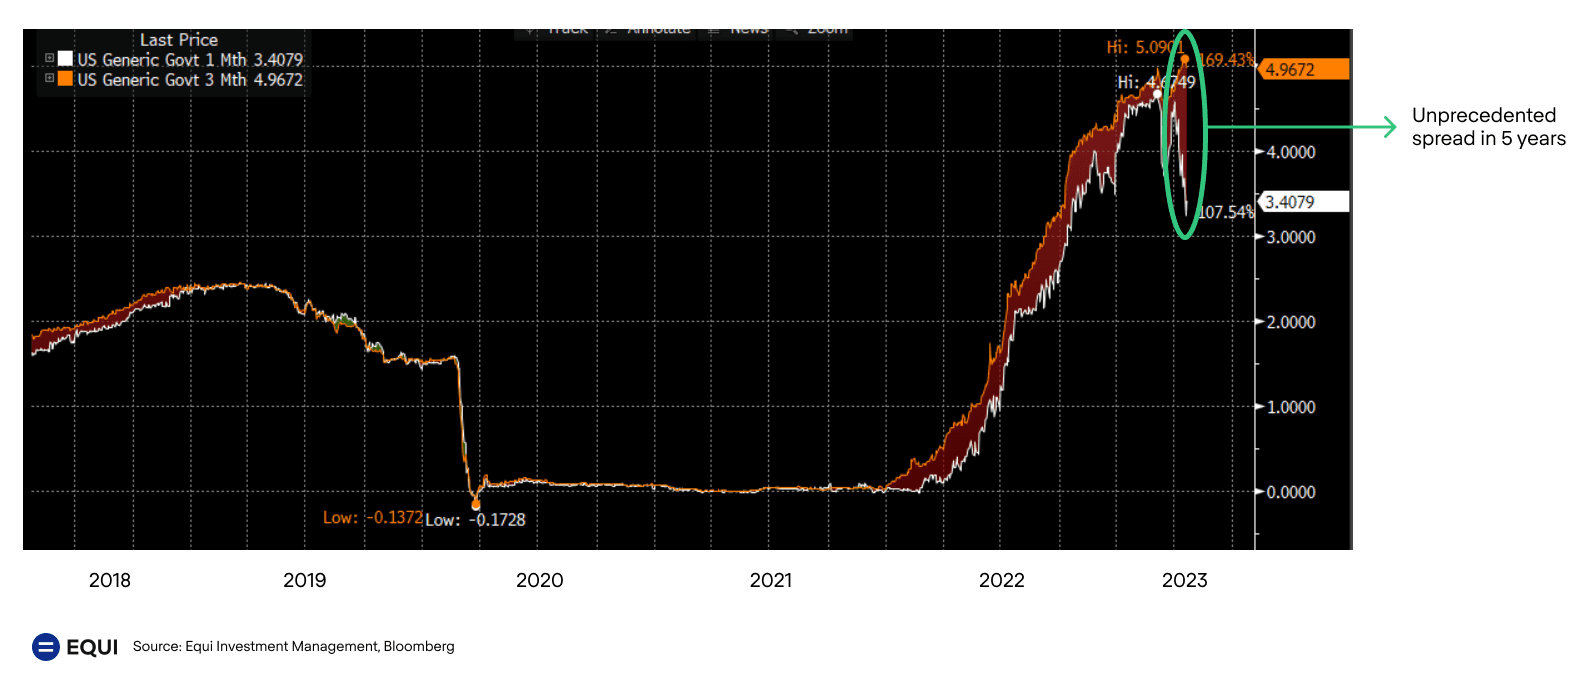
Data Point #1: Spreads
There’s suddenly a huge spread between one-month and three month Treasuries. That gap is strikingly wider than usual.
The spread between the one-month and three-month US Treasury rates, referred to as the yield curve, can vary depending on various economic and market conditions. In general, during times of economic expansion and optimism, the spread between the one-month and three-month Treasury rates tends to be relatively small or even positive, with the three-month rate slightly higher than the one-month rate. This is known as a "normal" yield curve. During times of market stress and uncertainty, the spread between the one-month and three-month Treasury rates may widen, resulting in a "steep" or "inverted" yield curve.
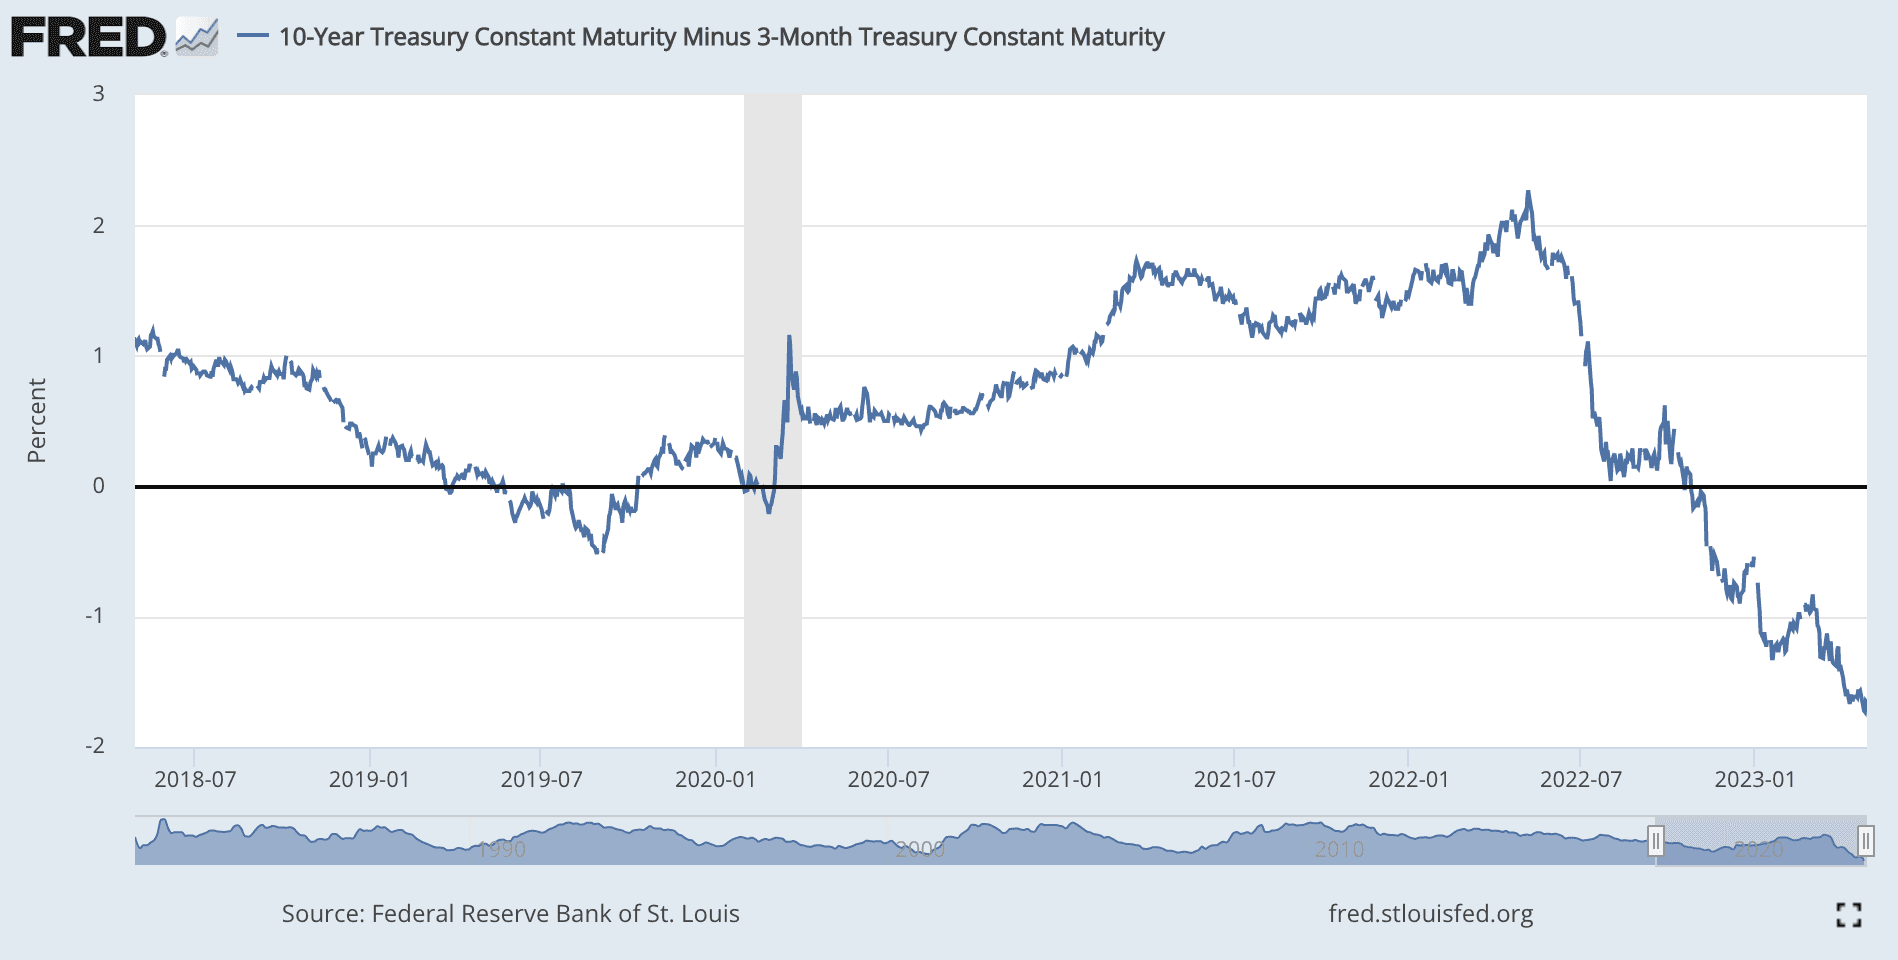
To view the extent of yield curve inversion, one can look to the following data from the St. Louis Federal Reserve. The 3-month T-bill yields are at 5.00%, while 10 year T-bill yields are at 3.55% resulting in an inversion of -145 basis points or -1.45%.
Data Point #2: Tax Revenue
You can thank Uncle Sam for that spread, at least partially. On April 18, Federal tax receipts were due and came in much lower than expected, meaning the government will have less money to pay its bills.
Here are some years in the past when US tax revenue collections missed expectations:
-
2008-2009: During the global financial crisis, US tax revenue collections fell below expectations due to the economic downturn, which resulted in lower incomes, reduced business profits, and lower tax payments.
-
2012: US tax revenue collections fell short of expectations due to slower-than-expected economic growth and high levels of unemployment, which resulted in lower incomes and reduced tax payments.
-
2020: The COVID-19 pandemic led to significant disruptions in the US economy, with widespread job losses, business closures, and economic contraction. As a result, US tax revenue collections were impacted, with lower-than-expected tax payments from both individuals and businesses.
Data Point #3: Debt Ceiling
Those lower than expected tax receipts have stoked concerns that the government will hit the debt ceiling sooner than anticipated, causing investors to seek out shorter duration bonds that mature before the potential default. Sure, the government can raise the debt ceiling, but it doesn’t appear that investors are so willing to make that bet right now.
Here are some notable years where this has happened:
-
2002 and 2003: The US debt ceiling was reached, and the Treasury Department began taking extraordinary measures, such as suspending investments in certain government funds, to avoid breaching the debt ceiling.
-
2011: The US debt ceiling was reached, and this event was particularly notable as it led to a contentious political debate in Congress over raising the debt ceiling, and credit rating agency Standard & Poor's downgraded the US’ credit rating from AAA to AA+ for the first time in history. On August 8, 2011, major stock indices dropped by more than 5%, which was the largest single-day point drop since December 2008. The stock market continued to experience significant swings, falling more than 20% in just 5 trading days.
-
2013: The US debt ceiling was reached again two years later. Members of Congress opposed raising the debt ceiling, which had been routinely raised previously on a bipartisan basis. The crisis ended on October 17, 2013 with the passing of the Continuing Appropriations Act.
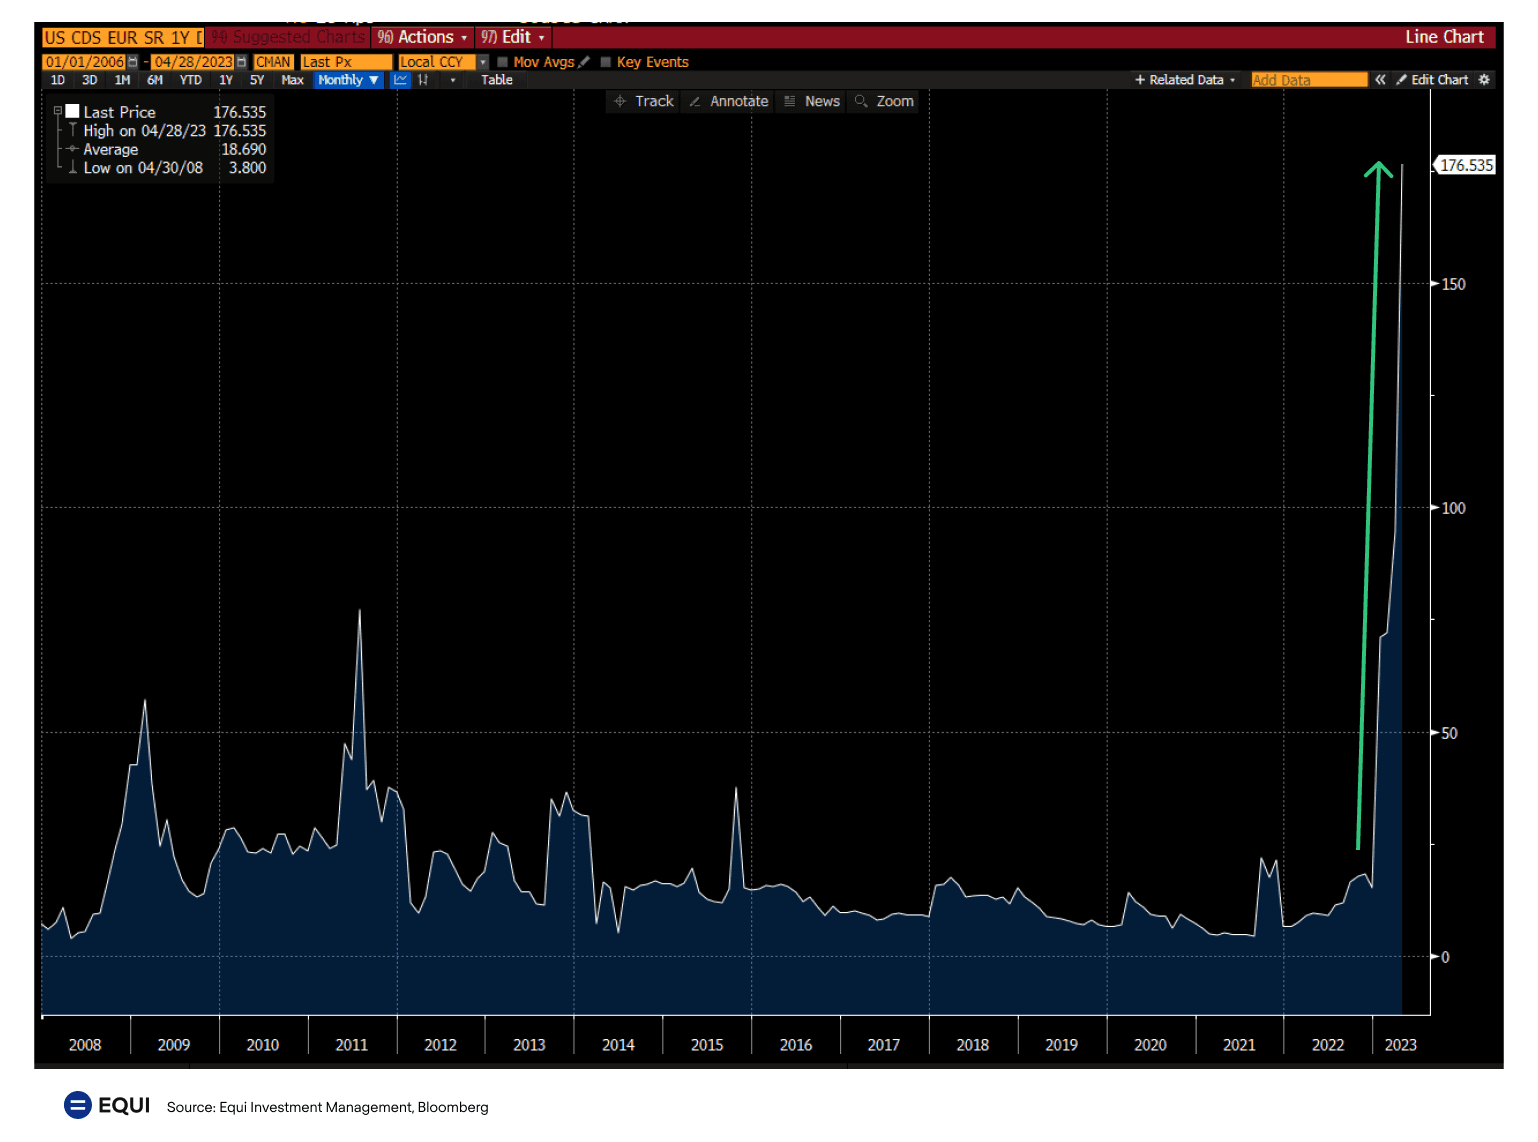
Data Point #4: Credit Default Swaps
Another way to measure how likely traders think a US default is, is by looking at credit default swaps. As of May 1, 2023, 1-year U.S. Treasury CDS (sold in Europe) is sitting at 176.535 basis points over the risk free rate. What this means is they're paying $17,653.50 per year to insure against $1M in U.S. Treasuries.
In the US, one year credit default swaps are currently trading above 100 basis points. The last time it was this high was at least 2008 and far higher than other points in history where there were concerns over the government hitting the debt ceiling. Looking farther out, traders are starting to push the cost of insuring five year debt to new levels, with the cost of five year credit default swaps sitting higher than 50 basis points, the highest levels we’ve seen in more than a decade.
So What
You might want to start rethinking the average 60-40 portfolio. Instead, Blackrock provides an analysis on how investors can evaluate the traditional 60-40 portfolio with alternative investments as a key driver of true diversification. Alternative investments whose return drivers are not as vulnerable to macroeconomic factors will likely play an increasingly important role in the portfolio of retail investors.
As the likelihood of a stock market crash increases, investors should seek to invest in assets that are uncorrelated with equities.