
What Are U.S. Treasury Securities?
When it comes to secure investments, U.S. Treasuries (UST) stand out as a beacon of financial stability. Issued by the Department of the Treasury to finance government spending, these debt securities are backed by the unwavering credit of the U.S. government, making them a safe haven for investors.
Let's break down the different types of U.S. Treasuries and their key features:
- Treasury Bills (T-Bills): T-Bills are like short-term loans to the government. They typically last from a few days to a year. When you buy them, you pay less than their full value. When they're due, the government pays you the full value back, so you make money.
- Treasury Notes and Bonds: These are also loans to the government, but they last longer, from 2 to 30 years. They pay you some money every 6 months based on how much you lent them. When they're due, the government pays back the full amount they borrowed.
- Floating Rate Notes (FRNs): These are also loans to the government, but they're special because the interest they pay can change based on how other interest rates change. This helps protect you if interest rates go up or down.
- Treasury Inflation-Protected Securities (TIPS): TIPS are loans that the government changes based on how prices change. So if prices go up, the amount you get back also goes up. They also pay you some money every 6 months based on the changed amount. This helps you keep up with the cost of living. These U.S. Treasury securities are issued at par value ($100 per security) through Treasury auctions, primarily handled by major investment banks acting as primary dealers.
Understanding the relationship between UST prices and yields is crucial. As a general rule, when prices increase, yields decrease, and vice versa. For instance, imagine holding a treasury bond with a 3% coupon rate, and market interest rates plummet to 2%. Despite the fall in rates, your bond still pays a 3% coupon rate, rendering it more valuable compared to newer bonds yielding just 2%.
Conversely, if market interest rates climb from 3% to 4%, your 3% bond will be up against newer treasury bonds offering a 4% coupon rate. In this scenario, the price of your 3% bond might drop to maintain equilibrium. Understanding these dynamics can assist investors in making informed decisions when navigating the U.S. Treasury market.
How to Read Signals from the Yield Curve
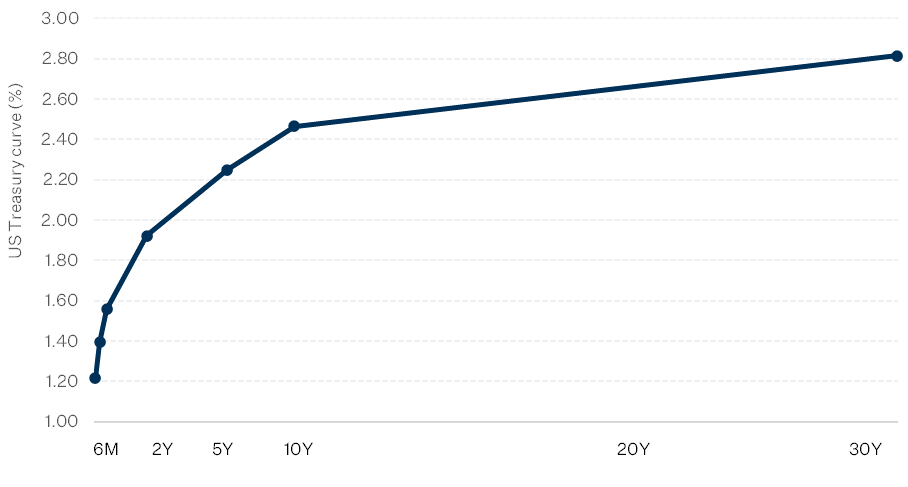
A Normal Yield Curve
The Treasury curve is a graphical representation of the yields on U.S. Treasury securities across different maturities. In other words, it’s a picture that shows how much the U.S. government has to pay people who lend it money for different amounts of time.
Usually, the Treasury curve goes up, indicating that the government has to pay more to individuals who lend money to it for a longer period of time. Generally, people want more money back if they lend their money for a longer time because it's a bit riskier and because they don’t have access to those funds for a longer amount of time.
The following chart depicts an example of a normal Treasury yield curve on January 2, 2018.
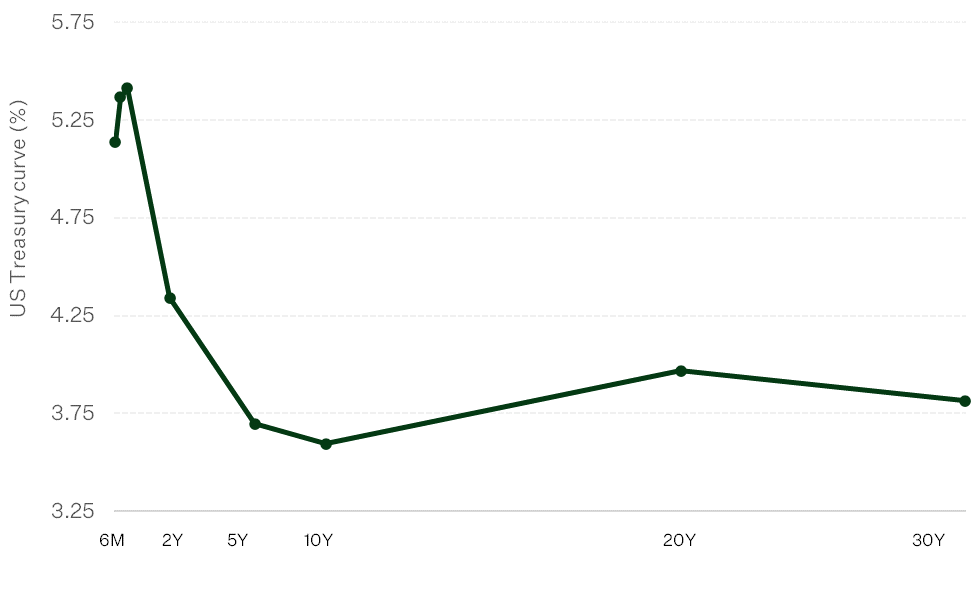
An Inverted Yield Curve
The yield curve is considered "inverted" when short-term yields are higher than intermediate- or long-term yields, resulting in lower short-term prices compared to long-term prices. This happens when investors expect an upcoming recession and are looking to store their money in a safe haven for the long-run.
This is an example of inverted Treasury yield curve on June 1, 2023.
How to Interpret UST Offerings
A typical information section for the U.S. Treasuries in a brokerage account may resemble the following.
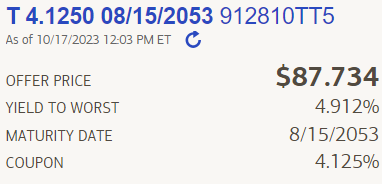
How to Parse the Information
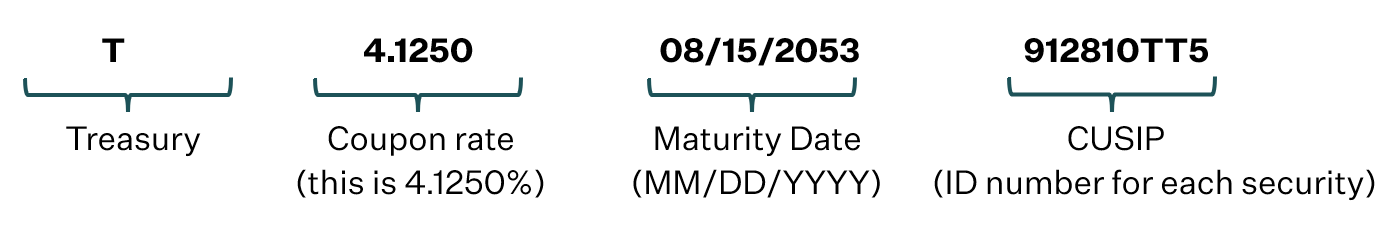
This is a 30-year Treasury Bond that pays a semi-annual coupon interest at 4.125% and matures on August 15, 2053.
- Offer Price: The listed market price of this 30-year U.S. Treasury (UST) bond. In this example, the price is $87.734 for one security, or $12.266 below par ($100).
Yield to Worst (YTW): This calculation indicates the lowest possible yield for a bond, assuming no complete default from the issuer. YTW is more relevant for callable bonds. In this instance, the
- YTW signifies that investors will receive, at a minimum, a yield of 4.912% if they hold the bond until maturity.
- Maturity Date: The date on which this bond matures, entitling investors to the principal amount and the final coupon interest payment.
- Coupon: The fixed rate at which interest payments will be disbursed. For every $100 invested in this bond, the investor will receive $4.125 every six months until the maturity date.
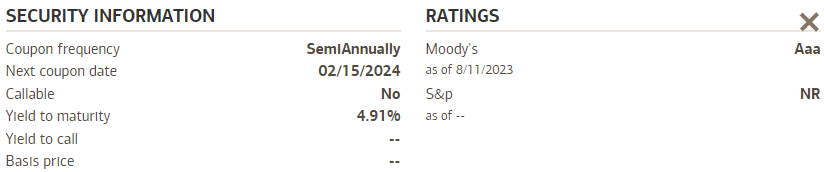
On the comprehensive security information screen, additional details about the bond are also available.
- Coupon frequency: Indicates how often the bond disburses interest payments. In this instance, the bond pays out semi-annually, equivalent to once every 6 months.
- Next coupon date: The upcoming date on which the bond will pay out interest. In this instance, the next coupon interest payment is scheduled for February 15, 2024.
- Callable: This bond is non-callable, meaning the issuer (the U.S. Department of the Treasury) cannot recall the bond once issued.
- Yield to maturity (YTM): Represents the anticipated rate of return if the instrument is held until maturity. YTM is expressed as an annual rate and considers the current market price, par value/principal amount, coupon interest rate, and time to maturity.
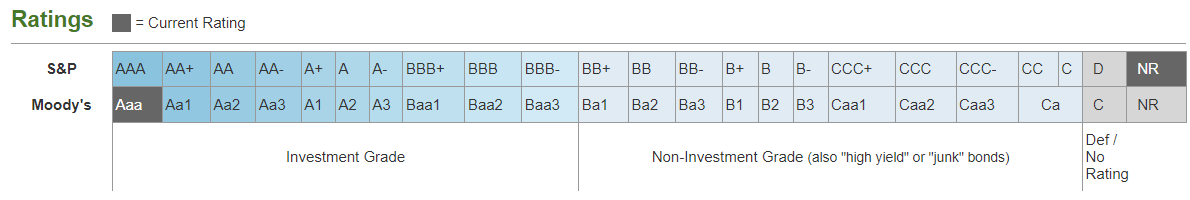
- Ratings from Moody’s: This is the credit rating of this bond. This rating serves as an indication of the safety or risk associated with this bond, as evaluated by Moody's, a credit rating agency. The Aaa rating, the highest achievable, signifies that this bond is among the most secure instruments in the market.
- Coupon frequency: Indicates how often the bond disburses interest payments. In this instance, the bond pays out semi-annually, equivalent to once every 6 months.
Why U.S. Treasuries
The current economic landscape is showing signs of potential trouble looming ahead. Inflation remains persistently high, amplified by unyielding oil prices that continue to put pressure on the market. Simultaneously, the housing sector is facing instability as soaring interest rates have led to a reduction in housing supply, coupled with challenges in affordability. Furthermore, a decline in household savings post-pandemic has exerted pressure on consumer spending, thereby contributing to a surge in business bankruptcies.
Given the precarious state of both the economic and political spheres, many investors are turning to U.S. Treasuries as a vital asset within their investment portfolios. As volatility remains a key concern, these treasuries are being viewed as a stable anchor amidst the unpredictable market conditions. With their reputation for security and reliability, U.S. Treasuries are increasingly seen as a safeguard for investors looking to protect their capital during uncertain times.
Where to get U.S. Treasuries
Investors can purchase U.S. Treasuries directly from the U.S. government at TreasuryDirect.gov. Alternatively, those who already have brokerage accounts can also purchase bonds on the secondary market or with exchange-traded funds (ETFs).